
Matthias Bartolo 0436103L

Through the following tasks, a deeper understanding of computer vision was achieved, with a particular focus on tools and frameworks that enabled its implementation:
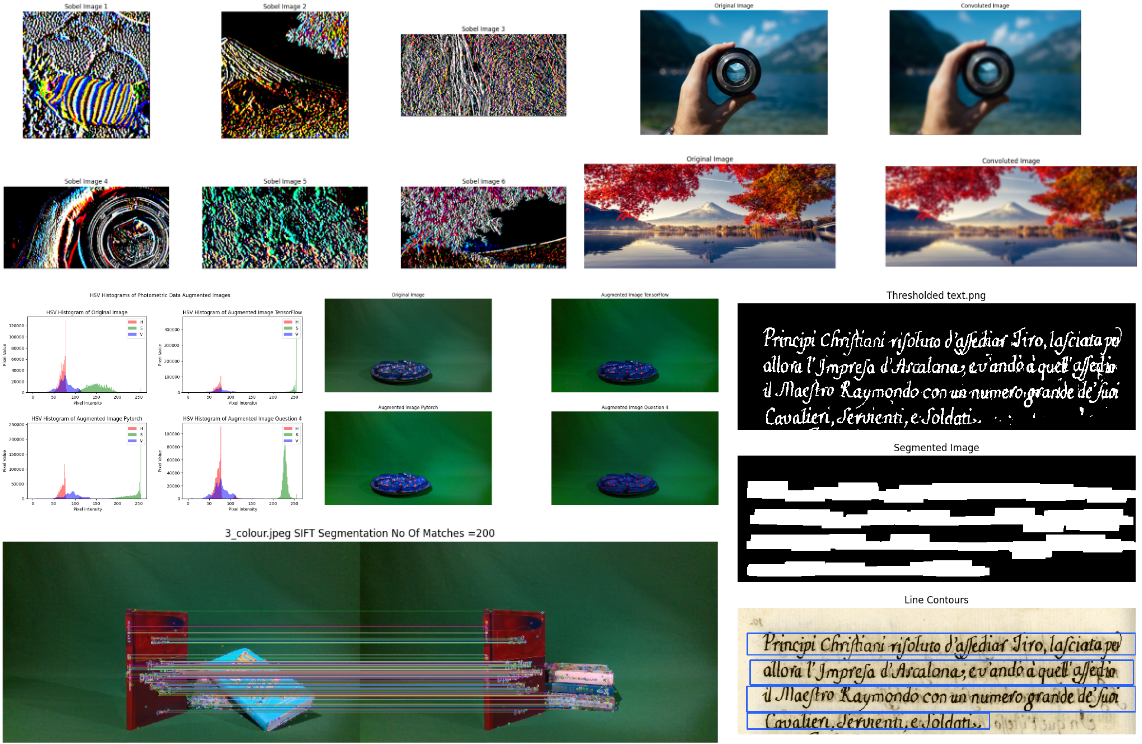
In the first part of the task, a variety of Data Augmentation techniques in computer vision were explored, encompassing both theoretical and practical aspects. The objectives involved investigating the concept of data augmentation, conducting a comprehensive review of relevant literature, implementing selected techniques using TensorFlow, PyTorch, and OpenCV, and evaluating the performance of augmented images in comparison to other approaches and the original images. Valuable insights into the potential and effectiveness of data augmentation techniques in computer vision were obtained.
In the second part of the task, various tutorials were followed to delve into specific tasks that enhance computer vision capabilities. This endeavor involved experimenting with a wide range of techniques, including both Point Processing and Area Processing. Convolution techniques, including sobel kernel, box filter, and gaussian kernel, were studied, as they play a fundamental role in tasks such as edge detection and smoothing. Additionally, Morphology operations like dilation, erosion, opening, closing, and text segmentation were explored, which are crucial for image processing tasks like noise removal, shape detection, and text extraction. Feature Detection techniques, such as Corner Harris, Sci Thomasi, SIFT, SURF, and ORB, were also examined, as they enable the identification and extraction of distinctive features for tasks like object recognition and tracking.

By completing these tasks, the project achieved a comprehensive understanding of computer vision principles and techniques. The exploration of data augmentation techniques, along with the utilization of tools and frameworks, provided valuable insights into the potential and effectiveness of computer vision applications.
The repository includes the Computer Vision Tutorials and Group Project.
